

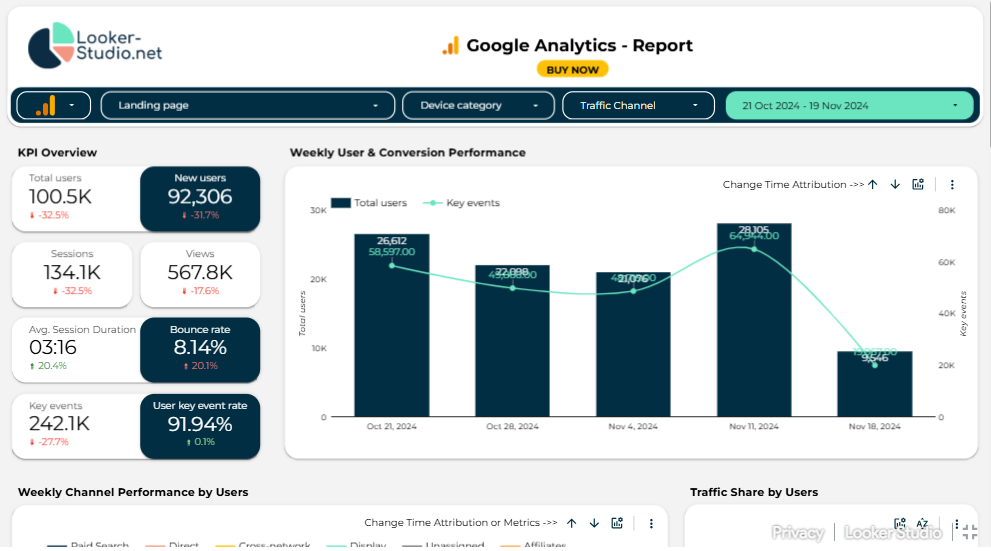


Struggling with Google Analytics reporting? Discover the power of my streamlined Google Analytics one-page report, offering a quick view of your website's KPIs such as total users, bounce rate, conversion rate, average session duration, and so on. By using the filter options for traffic channels and landing pages, you can effortlessly identify the sources and specific pages that drive traffic to your website, providing valuable insights into the effectiveness of your marketing strategies and user engagement tactics. Simplify your reporting process and unlock actionable opportunities for optimization with just a few clicks. Don't hesitate and enhance your reporting with a simple click!
Visualise all your Google Analytics data on Looker Studio
With my expertise in Looker Studio, I've crafted numerous Google Analytics Reports for leading agencies and companies. When developing this template, I focused on implementing industry best practices and spotlighting key performance indicators that are crucial for maximizing your website's effectiveness.
Filter your Data
Use the filter section to sort your data based on various factors. This helps you figure out the specific times, locations, and reasons why your data performed better.
- The landing page filter in the report provides a focused analysis of specific landing pages, revealing performance metrics such as bounce rate and conversion rate. By honing in on individual pages, you can identify strengths and weaknesses in your website's user experience and conversion funnel.
- With the Traffic Channel Filter, you can narrow down your data to either Paid Search, Organic Search, Direct Traffic, Email, etc. This means you can focus specifically on the performance metrics related to each source individually.
- The device category filter within the report allows for targeted analysis based on the type of device used by visitors, such as desktop, mobile, or tablet. By segmenting data according to device categories, you can gain insights into how user behaviour and engagement vary across different devices
- The Time Filter lets you analyse your data during specific periods, helping you focus on performance metrics within those time frames.

Google Analytics Funnel
The Funnel segment in the report facilitates a methodical analysis of your data. It guides you through a step-by-step evaluation, providing a clear view of key metrics such as overall users, sessions, average session duration, and total conversions. Additionally, you can monitor both bounce rate percentage and user conversion rate to gain comprehensive insights into your website's performance. 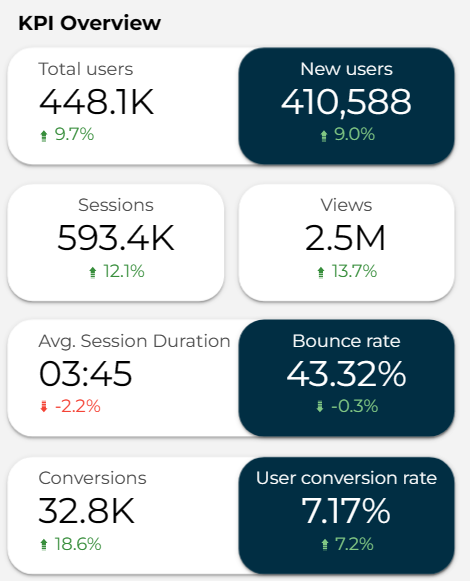
Time Charts
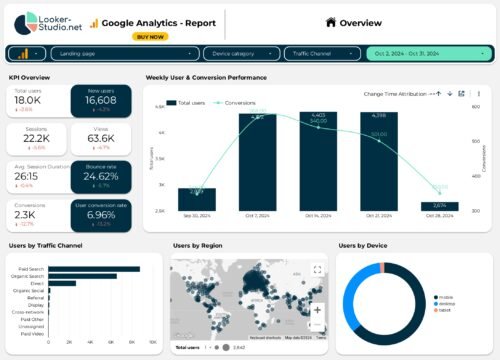
While tracking data through a funnel is essential, analysing trends over time is equally important. The template incorporates two time charts that capture essential key performance indicators over time, including: Weekly User & Conversion Performance Weekly Channel Performance by Users  By default, the charts are displayed weekly, but you can easily switch to a different view using the top bar of the charts. If you want to modify the metrics, that's no issue – you have the flexibility to make those changes as well.
Demographics
Quickly examine the performance of your demographics based on age and gender to identify what resonates best with your product. By doing so, you can determine if a specific age group or gender is more receptive to your brand and take actions accordingly. 
A real white-label report for your agency or company
You can easily adjust every chart, font, Logo, and color according to your Branding Identity. While creating the report everything was kept simple so that you can easily adjust it to your needs.

Share it with your clients or colleagues
The Google Analytics Template report is fully automated and you can easily share it with your clients or team. Direct access to your Google Analytics account isn’t necessary because they can easily view the data in Looker Studio. 
What are the Next Steps?
Video Guide: Once you buy the report, you will receive a step-by-step video guide for the following steps: Copy the template: You’ll get direct access to our Google Analytics Report Template for Looker Studio. You will have to copy it and switch the data sources. Don’t worry, it's very easy and you don’t need any technical knowledge. Customization: Now you can rename the report and switch the logo if you want to.
Ready to analyze your Google Analytics with new insights?
Gain fresh insights on your Google Analytics data through this One-Page Looker Studio Reporting Template. Identify and enhance bottlenecks or effortlessly share the report with partners and clients. Don't hesitate—purchase the template now and experience your Google Analytics data in a whole new light!
Frequently Asked Questions
Is it possible to have automated email reporting?
Is Looker Studio Free?
Do you need a branded report for your agency or company?
Is this a White Label GA4 Looker Studio Template?
Do I need to buy a Connector for this?
Check Out More Templates
-
Sale!


GA4 E-Commerce Template
My GA4 E-commerce report template was designed to simplify tracking of key metrics including user behaviour, device preferences, and channel performance, enabling you to tailor your marketing strategies effectively.Original price was: €120,00.€99,99Current price is: €99,99. -
Sale!

GA4 Looker Studio Template Ultimate
It is a one-stop solution for all your analytical needs, covering everything from analyzing traffic channels, conversions, and pages to providing a complete and comprehensive e-commerce section.Original price was: €199,99.€179,99Current price is: €179,99.


GA4 Looker Studio Template One Page
Discover the power of my streamlined Google Analytics one-page report, offering a quick view of your website’s KPIs such as total users, bounce rate, conversion rate, average session duration, and so on.
€89,99
Filter The Report
by Landing Page, Device Category, and Traffic Channel
KPI Funnel
Analyze your best-performing
channels and regions
Secure payment
Secure payment
Moneyback guarantee
Customer Reviews
Artur helped us automate our reporting …
Artur helped us automate our reporting and created a fully automated Looker Studio...It was such a pleasure working with …
It was such a...
Reviews
There are no reviews yet.