


Our fully automated Shopify Analytics Dashboard in Looker Studio is designed using best practices from across the industry. It ensures that every important Shopify KPI is presented in a visually appealing and easy-to-understand format. Why waste time manually creating reports when the perfect tool is just a few clicks away? Automate your reporting process and leave a lasting impression on your clients with a sleek, professional Shopify report. Get started now and take your reporting to the next level!
Visualize your Shopify Analytics in Looker Studio
As a Looker Studio expert, I have created numerous Shopify performance reports customized for e-commerce businesses and marketing agencies. When creating these reports, I focused on best practices and critical KPIs that are essential for optimizing your Shopify store's performance and driving growth.
Filter Your Data
Use the filter section on Looker Studio to sort sales-related data based on different factors.
- The Traffic Source Filter enables sales analysis across various sales channels like Facebook, Instagram, TikTok, Google Search etc.
- The Product Title Filter allows for a detailed breakdown of sales by individual products within the store.
- The Fulfillment Status Filter provides insights into order progress based on their fulfillment stages.
- The Date Filter facilitates the review of sales data within a specified time frame.
Shopify Analytics
The purchase funnel in the report helps you analyze your sales based on the orders. It assists you in finding out how many customers arrived at the store, how many orders were placed, and also the number of items ordered. Additionally, you can also calculate net sales, order taxes, order value, and discounts.

Shopify daily sales report
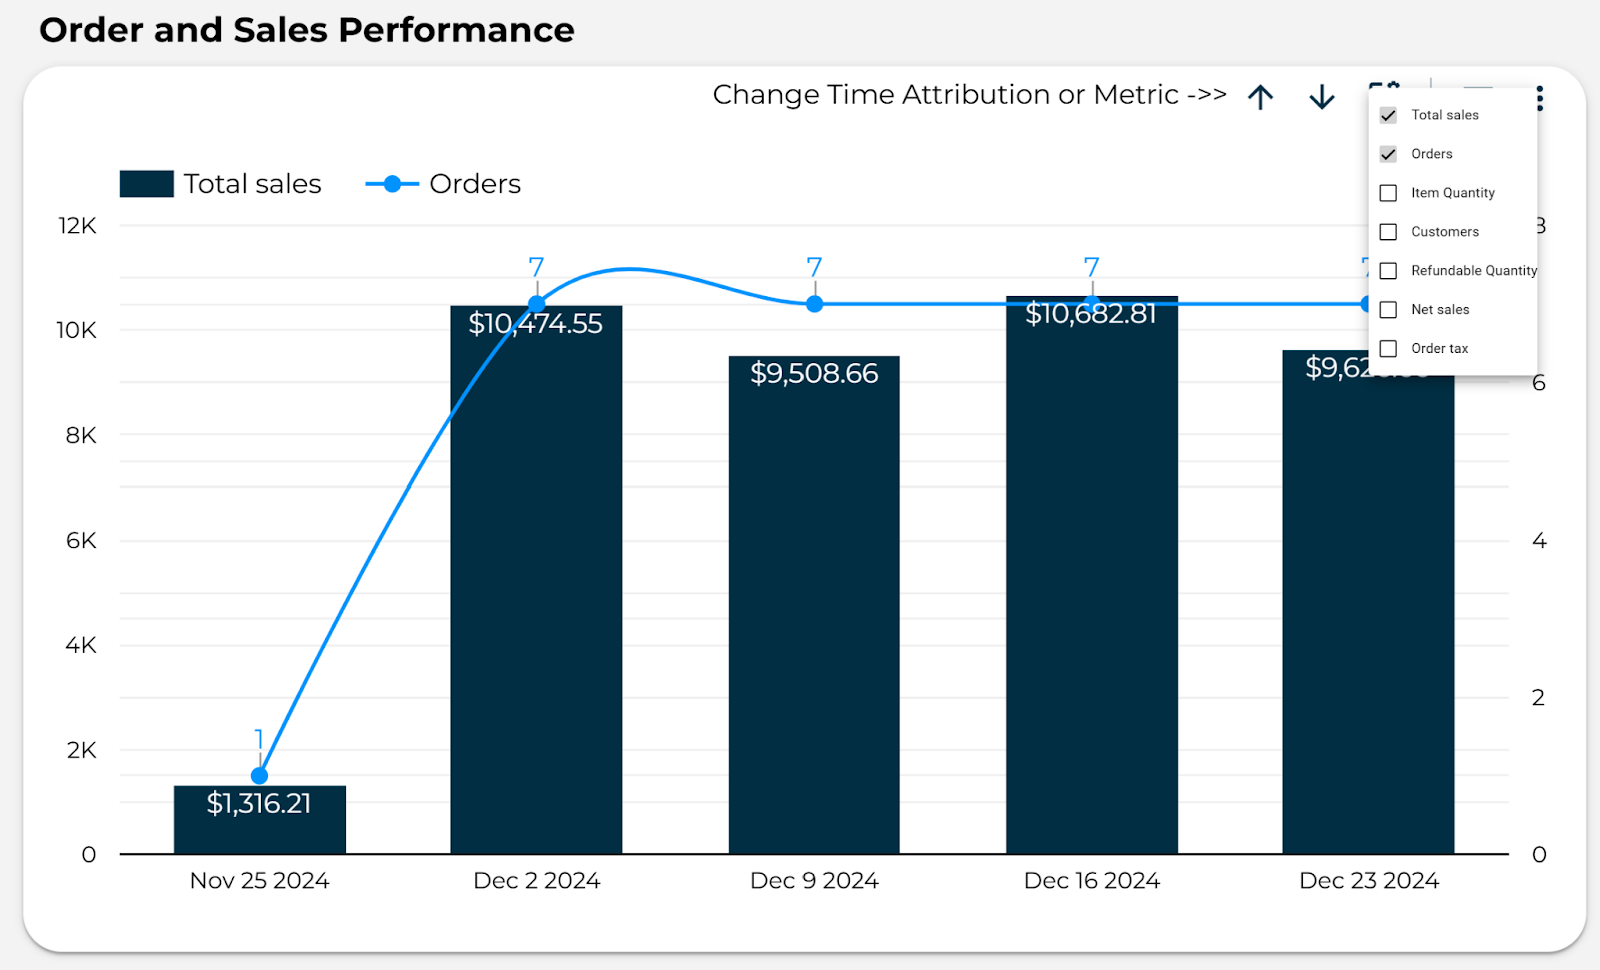
Tracking data through the Purchase Funnel is essential, but analyzing trends over time is just as important. This template includes three charts designed to showcase multiple key performance indicators (KPIs) over specific periods, providing valuable insights into performance trends. These include:
- Total Sales
- Total Orders
- Fulfillment Status
- Refunds
By default, the charts display weekly data, but you can easily switch to a different view using the top bar of the charts. If you want to modify the metrics, that would not be an issue as you have the flexibility to make those changes.
Revenue
Quickly check your revenue on different channels. You can easily find out which channels provide the most sales.

You can gain insights into store revenue by examining order fulfillment status and analyzing sales performance across different days of the week. This allows you to find out on which days your store gets the most customers.

Traffic Source Performance
If you are generating revenue from different referral traffic sources, it is important to know their exact names and how much sales they’re bringing in. This can tell you about the performance of each referrer. This allows you to calculate total sales coming from a single reference as well as the average order value.

Shopify sales report by product
Understanding the performance of individual product titles is critical for optimizing your Shopify store's inventory and marketing strategies. Looker Studio enables you to analyze how each product variant contributes to overall sales. It also helps detect products with low sales to strategize better inventory management or marketing campaigns. Compare revenue generated by variants against associated costs and discounts to find net profit.

A Fully Customizable Shopify Report for Your Agency or Business
This Shopify report is designed to be a true white-label solution, allowing you to easily align it with your brand identity. Every element including charts, fonts, logos, and colors can be easily customized to reflect your branding. The report's layout has been intentionally kept simple so that you can quickly adapt it to meet your specific requirements.

Share It with Your Clients or Team
The Shopify report is fully automated and designed for sharing with your clients or colleagues. Direct access to your Shopify account isn’t required, as the data can be easily viewed in Looker Studio. This ensures secure and efficient collaboration while keeping everyone informed on performance insights.

How to Proceed After Payment?
- Video Guide: Once you buy the report, you will receive a step-by-step video guide for the following steps.
- Connector: Start a free trial with Power My Analytics and connect your Shopify Account.
- Copy the template: You’ll get direct access to our Shopify Report Template for Looker Studio. You can copy it and switch the data sources. Don’t worry; the process is very easy and you don’t need any experience.
- Customization: After this, you can rename the report and customize the logo if you want to.
Ready to elevate your Shopify sales reporting?
Take your Shopify analytics to the next level with our expertly designed Looker Studio Reporting Template. Track essential metrics, optimize your sales channels, and impress your clients with professional, automated reports. Don't spend hours creating reports manually—let this template handle the hard work for you!
Frequently Asked Questions
Can this Shopify report be sent automatically by email?
Is Looker Studio Free?
Do you need a branded report for your agency or company?
Is there a free trial available?
Do I need to buy a connector to use this Shopify Reporting Template?
Shopify Analytics Report Template
Having trouble finding a Shopify sales report? Unsure which key metrics to highlight from your e-commerce business and how to display them effectively? We have the ideal solution for you!
€99,99
Filter The Report
by Landing Page, Device Category, and Traffic Channel
KPI Funnel
Analyze your best-performing
channels and regions
Secure payment
Secure payment
Moneyback guarantee
Customer Reviews
Artur helped us automate our reporting …
Artur helped us automate our reporting and created a fully automated Looker Studio...It was such a pleasure working with …
It was such a...
Reviews
There are no reviews yet.