


Struggling to navigate Google Ads reporting?
Experience the power of visual data representation with my one-page Google Ads Dashboard Template. Gain valuable insights into your campaign performance through clear and visually appealing displays of essential metrics like CPC, Conversion Rate, and CPA. With this intuitive format, you can easily identify trends, pinpoint areas for improvement, and showcase the impact of your advertising efforts to clients and stakeholders.
Elevate your reporting and make informed decisions with confidence, all while impressing your clients with polished and visually captivating reports. Get your Google Ads Dashboard Template Now!
Unlock the power of Looker Studio to visualize your Google Ads Data in a one-page dashboard
As a Looker Studio expert I have created several Google Ads Reports for Marketing Agencies and companies. While creating this template I focused on best practices and the most important KPIs which are crucial for your performance marketing.
Filter your Data
Use the filter section to sort your data based on various factors. This helps you figure out the specific times, locations, and reasons why your data performed better.
-
- With the Campaign Type filter, you can narrow down your data to either Search or Shopping. This means you can focus specifically on the performance metrics related to each type individually.
- The Campaign filter allows you to analyze all of the KPIs for one specific campaign from your Google Ads Account. This data helps you compare individual performance per campaign, making future budget and performance decisions easier.
- The Device filter within the report allows for targeted analysis based on the type of device used by visitors, such as desktop, mobile, or tablet. By segmenting data according to device categories, you can gain insights into how user behavior and engagement vary across different devices.
- The Time Filter lets you analyze your data during specific periods, helping you focus on performance metrics within those time frames.

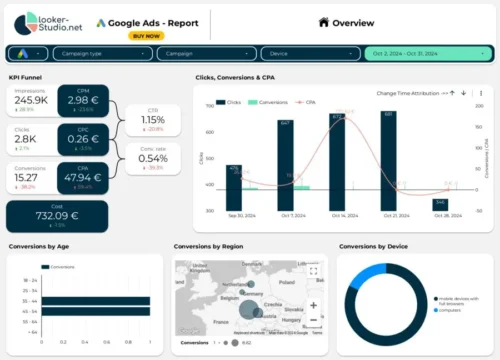
Google Ads Funnel
The Funnel section in the report helps you analyze your Campaign data step by step. It lets you easily determine how many people saw, clicked, and converted through your ads. Additionally, you can see the costs and percentage ratios for each step of the conversion funnel.

Time Charts
This template includes three-time charts that capture key performance indicators (KPIs) over time such as:
Impressions, Clicks & CTR
Cost & CPC
Conversions & CPA

Demographics
Easily analyze how different age groups respond to your ads to identify the most receptive demographic segments. This helps you understand which audiences are most attracted to your advertisements and make changes accordingly.

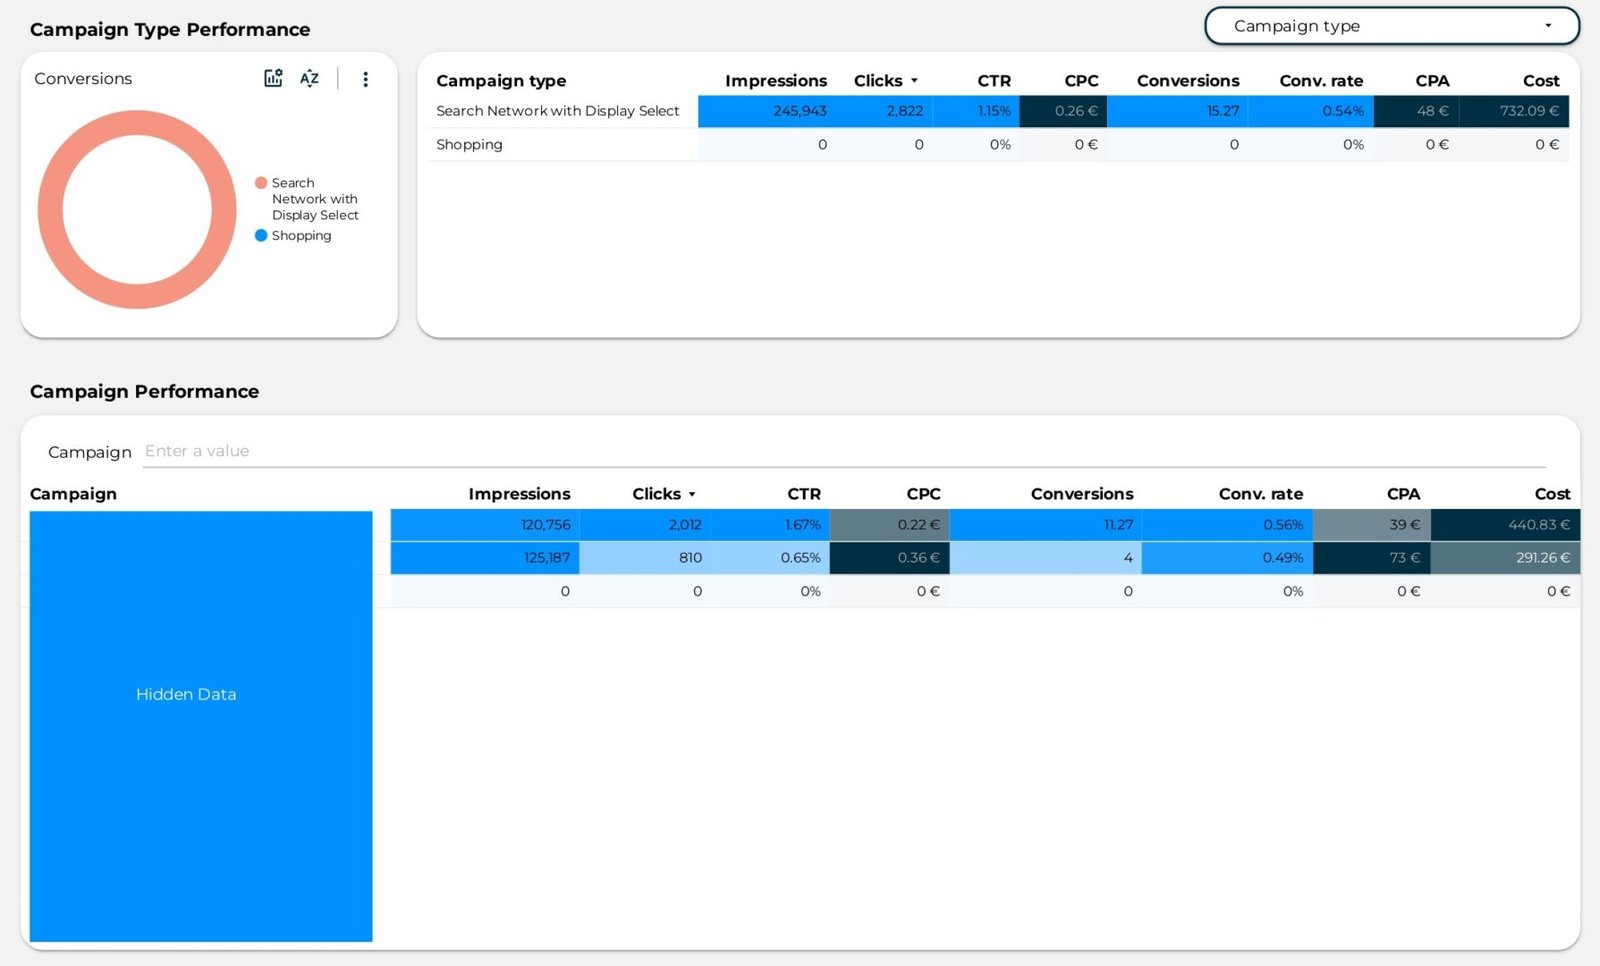
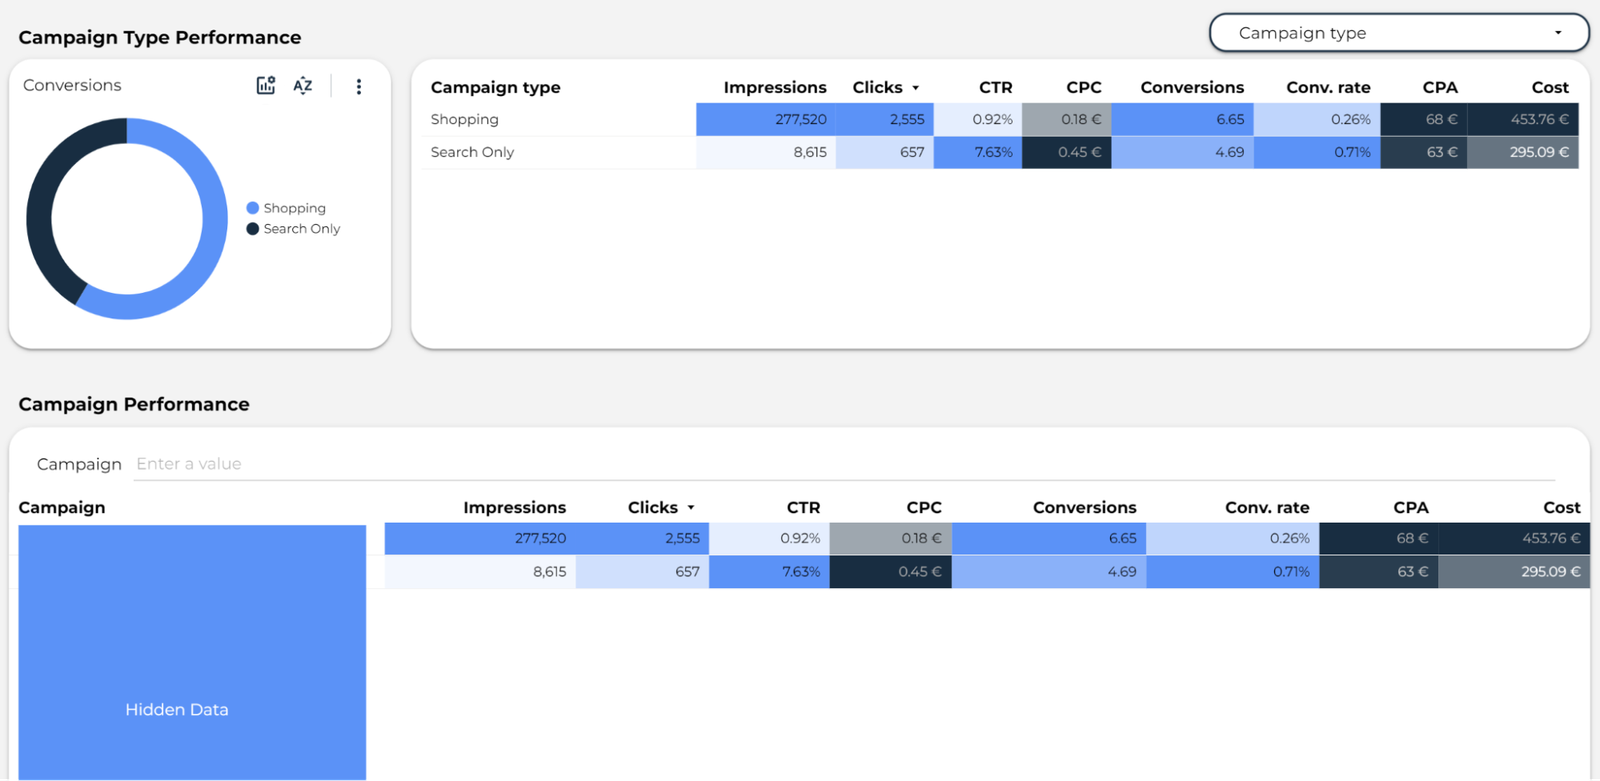
Campaign Type and Campaign Performance
When managing a variety of campaigns, it's imperative to analyze both the individual performance of each campaign and their respective types, such as Search or Shopping campaigns. This insight allows you to identify the top-performing campaigns within each type, as well as pinpoint any underperforming ones. By strategically reallocating resources and investments to the most successful campaigns and types, you can optimize your overall advertising strategy and achieve superior outcomes.
A real white-label report for your agency or company
You can easily adjust every chart, font, Logo, and color according to your Branding Identity. While creating the report everything was kept simple so that you can easily adjust it to your needs.
Share it with your clients or colleagues
The Google Ads Dashboard Template report is fully automated and you can easily share it with your clients or team. Direct access to your Google Ads account isn’t necessary because they can easily view the data in Looker Studio.

What are the Next Steps?
Video Guide: Once you buy the report, you will receive a step-by-step video guide for the following steps.
Copy the template: You’ll get direct access to the Google Ads Dashboard Template for Looker Studio. You will have to copy it and switch the data sources. Don’t worry it’s very easy and you don’t need any technical knowledge.
Customization: Now you can rename the report and switch the logo if you want to.
Ready to analyze your Google Ads with new insights?
Unlock fresh insights into your Google Ads performance using my streamlined Looker Studio Reporting Template. Identify bottlenecks, optimize performance, or effortlessly share the report with partners and clients—all on one page. Don't hesitate—purchase the template now and gain a deeper understanding of your Google Ads data like never before!
Frequently Asked Questions
Is it possible to have automated email reporting?
Is Looker Studio Free?
Do you need a branded report for your agency or company?
Is this a White Label Google Ads Report Template?
Do I need to buy a Connector for this?

Google Ads Report Template One Page
Experience the power of visual data representation with my one-page Google Ads Dashboard Template. Gain valuable insights into your campaign performance through clear and visually appealing displays of essential metrics like CPC, Conversion Rate, and CPA.
€99,99
Filter The Report
by Landing Page, Device Category, and Traffic Channel
KPI Funnel
Analyze your best-performing
channels and regions
Secure payment
Secure payment
Moneyback guarantee
Customer Reviews
Artur helped us automate our reporting …
Artur helped us automate our reporting and created a fully automated Looker Studio...It was such a pleasure working with …
It was such a...